Appearance
Dashboard
When you log in to Upscale ERP, the first page you see is the Dashboard page, offering a clear snapshot of your organization's financial status.
Business Overview Tab
The Business Overview tab offers a quick summary of your organization's financial status, featuring sections such as: Orders Completed, Revenue,Expenses, Customers, Cash Flow, Invoices & Bills, Profit & Loss and more. These sections, along with the visual charts, help you quickly assess your organization's financial health.
Orders Completed
The Orders Completed component shows the total number of successfully fulfilled orders within a specific time frame, enabling you to track your sales performance.
Revenue
The Revenue component shows the total income generated from sales activities over a specific period. It helps monitor earnings and assess the overall financial growth of the organization.
Expenses
The Expenses component outline all the costs accrued by your organization, including operational expenses, cost of goods sold, salaries, rent, utilities, and other expenditures.
Customers
The Customers component provides a summary of the total number of customers your organization has acquired over a specific period.
Cash Flow
Within Upscale ERP, the Cash Flow component illustrates the movement of cash into and out of your organization. The Cash Flow Graph is created based on your organization’s cash flow report and consists of three sections: money in, money out, and net change.
Money in: represents the cash inflows to your organization. It indicates the total amount of cash your business has received during the specified period.
Money out: represents the cash outflows from your organization, including expenses such as operational costs, salaries, rent, utilities, and payments to suppliers. It shows the total amount of cash your business has spent during the specified period.
Net Change represents the difference between the total cash inflows and outflows. It indicates the net cash flow of your organization during the specified period. A positive net change means you have more cash coming in than going out, while a negative net change indicates higher cash outflows than inflows.
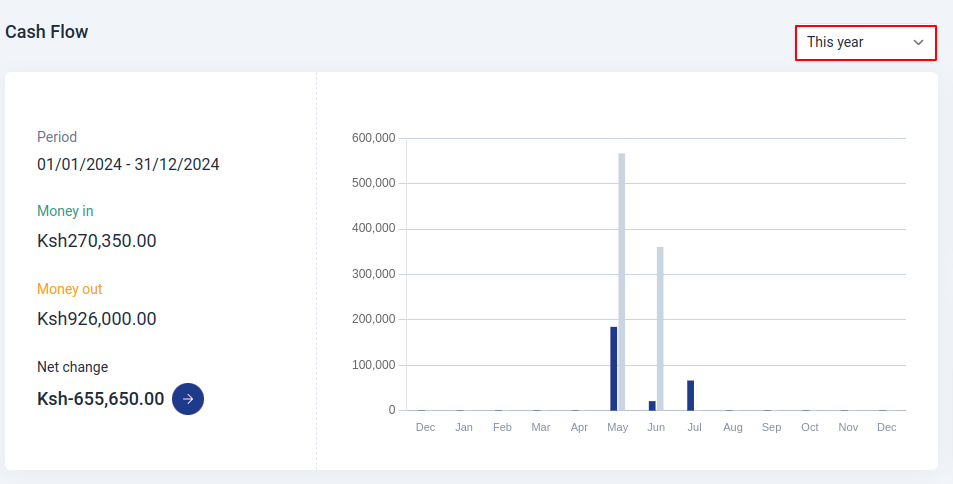
Additionally, the graph can be customized to display data for various time periods, such as yearly, monthly, etc.
Invoices & Bills
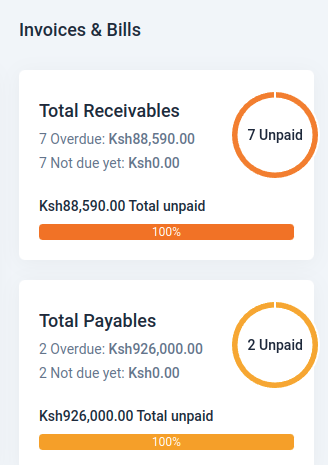
Total Receivables
In Upscale ERP, the Total Receivables component displays the total amount of money owed to your organization by customers. It includes all outstanding invoice amount to be received from customers. It contains the following sections:
Overdue: represents the total amount of money that is past due and has not been paid by customers within the specified time frame.
Not due yet: represents the total amount of money that is not yet due and will be paid by customers in the future.
Total unpaid: represents the total amount of money that is yet to be paid by customers, including both overdue and not due yet amounts.
Total Payables
The Total Payables component displays the total amount of money your organization owes to suppliers and vendors. It includes all outstanding bills that need to be paid. It contains the following sections:
Overdue: represents the total amount of money that is past due and has not been paid to suppliers within the specified time frame.
Not due yet: represents the total amount of money that is not yet due and will be paid to suppliers in the future.
Total unpaid: represents the total amount of money that is yet to be paid to suppliers, including both overdue and not due yet amounts.
Profit & Loss

The Profit & Loss component provides a summary of your organization's financial performance over a specific period. It includes the following components:
Total income: represents the total revenue generated by your organization from sales activities, including product sales, services, and other income sources.
Total expenses: represents the total costs incurred by your organization, including operational expenses, cost of goods sold, salaries, rent, utilities, and other expenditures.
Net profit: represents the difference between total income and total expenses. It indicates the overall profitability of your organization during the specified period. A positive net profit indicates that your organization has generated more revenue than expenses, resulting in a profit. A negative net profit indicates that your organization has incurred more expenses than revenue, resulting in a loss.
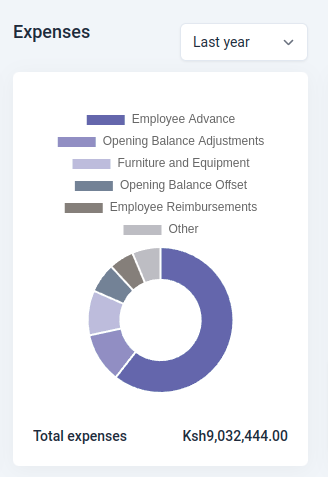
Expenses
The Expenses component provides a detailed breakdown of all costs incurred by your organization, including operational expenses, cost of goods sold, salaries, rent, utilities, and other expenditures.
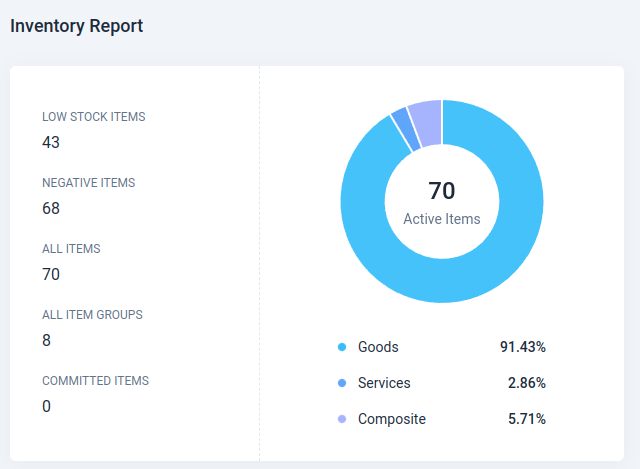
Inventory Report
The Inventory Report component displays the current status of your organization's inventory, including the total number of items in stock, the total value of inventory, and the number of items sold. It helps you monitor your inventory levels and make informed decisions regarding stock management.
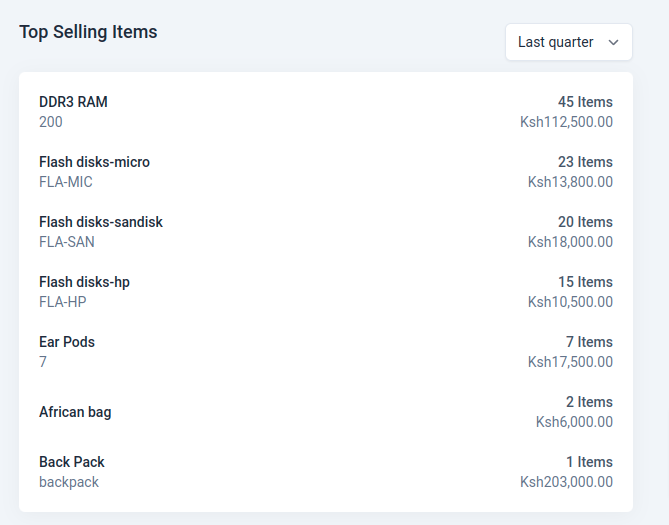
Top Selling Items
The Top Selling Items component lists the most popular products or services sold by your organization, along with the total number of units sold and the total revenue generated from these items. It helps you identify the best-selling products and optimize your sales strategy accordingly.